|
|
||||
|
|
||||||||||

Anybody who has tried to use MRTG to log performance stats for
XP/2000/2003 will have been frustrated by the lack of MIB variables
available. Here's how to get around this problem and use any
XP/2000/2003 performance counter (see picture 1).
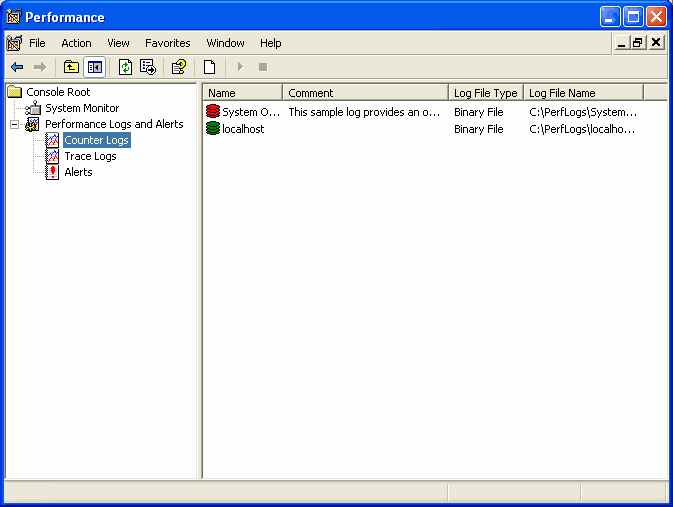
Download and install the following programs on your Microsoft Windows XP/2000/2003: Logging data with Performance Monitor Run Performance Monitor and open Performance Logs and Alerts. You should see a screen (see picture 1) similar to the following:
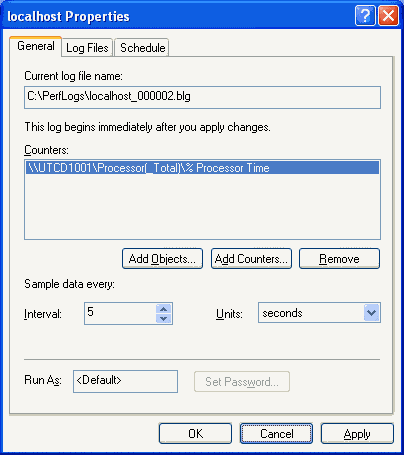
Right click Counter Logs then click New Log Settings. Enter the name of the server you want to monitor In this case it is test, then press Enter. The following window (see picture 2) will appear:
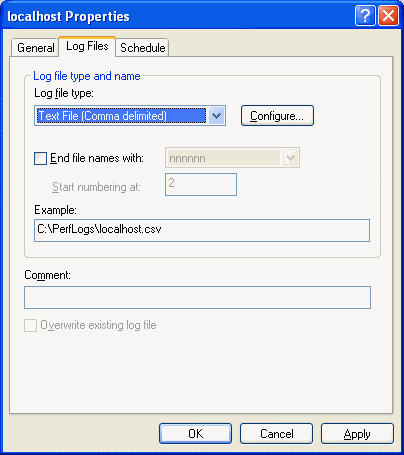
Click Add Objets and then select the counters you would like to monitor. These can be from any XP/2000/2003 server on your network. When you have added the appropriate counters click Close, then change the Sample data interval to 5 minutes. Select the Log Files Tab. Remove the tick from the End file names with check box and change the Log file type to Text File - CSV as shown in the following screen print (see picture 3).
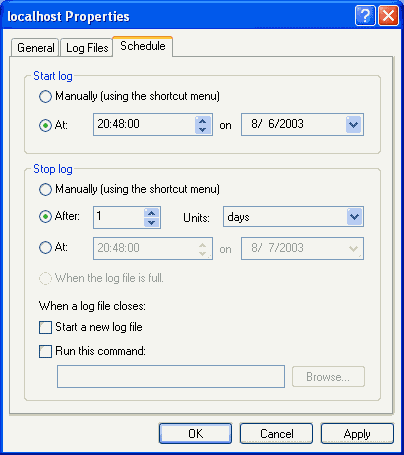
Select the Schedule tab, select Stop log After 1 day and Start a new log file when a log file closes as shown in the following screen print (see picture 4).
Click OK and the log file should start automatically. Now that you are collecting the stats to the CSV file you can now create a config file for MRTG to graph the data. Creating the MRTG configuration file To create a configuration file for MRTG to use, you can run the mkcfg.pl script that I put together. This reads the CSV file created by performance monitor and outputs a simple MRTG config file. # mkcfg.pl {
if ($entry =~ /PDH-CSV 4.0/i) Put this script inc:\mrtg\bin\mkcfg.pl To run the script, open a command prompt and type the following. c: Open the cfg file and check the result. The entries in the config file should match the performance counters that you selected. In the config maker script I have set MaxBytes to 100. The config file generated can be edited manually if required to set a more realistic value, but the setting of 100 will work reasonably well. Log the data with Performance Monitor for a few days and open the CSV file with Excel to get an idea of what Maxbytes value you should set. Important - If the graphs don't look right then adjust the MaxBytes value in the cfg file. Delete the associated png file in the logs directory and wait for the next update. Save the file and exit notepad. Under c:\mrtg\logs create a directory for the log files. In this case I create a directory called test. Collecting the stats To use the config file created you must put the following perl script in c:\mrtg\bin # getlog.pl Enter the following: c:\mrtg\bin>perl mrtg test.cfg If you now look in the c:\mrtg\logs\test directory, there should be a bunch of files. Look for the html files. These are the MRTG web pages for each performance counter. Running MRTG automatically There are different ways to do this, I use the following method: Create a perl script containing the following: $interval=300; while (1) { sleep( $interval - time() % $interval
); This will run every 5 minutes and update the graphs for you. Put this in the Windows startup group so that when you log on it will run automatically.
|
|
|
|
|
|
|
|
|


